Let’s talk about Kubernetes Deployment Challenges…
As monolithic systems become too large to deal with, many enterprises are drawn to breaking them down into the microservices architecture.Whenever we move from monolithic to microservice architecture, application consists of multiple components in terms of services talking to each other. Each components has its own resources and can be scaled individually. If we talk about Kubernetes, it can become very complex with all the objects you need to handle ― such as ConfigMaps, services, pods, Persistent Volumes ― in addition to the number of releases you need to manage. The below list of challenges might occur :
Helm is a Deployment Management(and NOT JUST PACKAGE MANAGER) for Kubernetes. It does a heavy lifting of repeatable deployment, management of dependencies(reuse and share), management of multiple configurations, update, rollback and test application deployments(Releases).
Under this blog post, we will test drive Helm on top of Play with Kubernetes Platform. Let’s get started.
Open https://labs.play-with-k8s.com/ to access Kubernetes Playground.
Click on the Login button to authenticate with Docker Hub or GitHub ID.
 Once you start the session, you will have your own lab environment.
Adding First Kubernetes Node
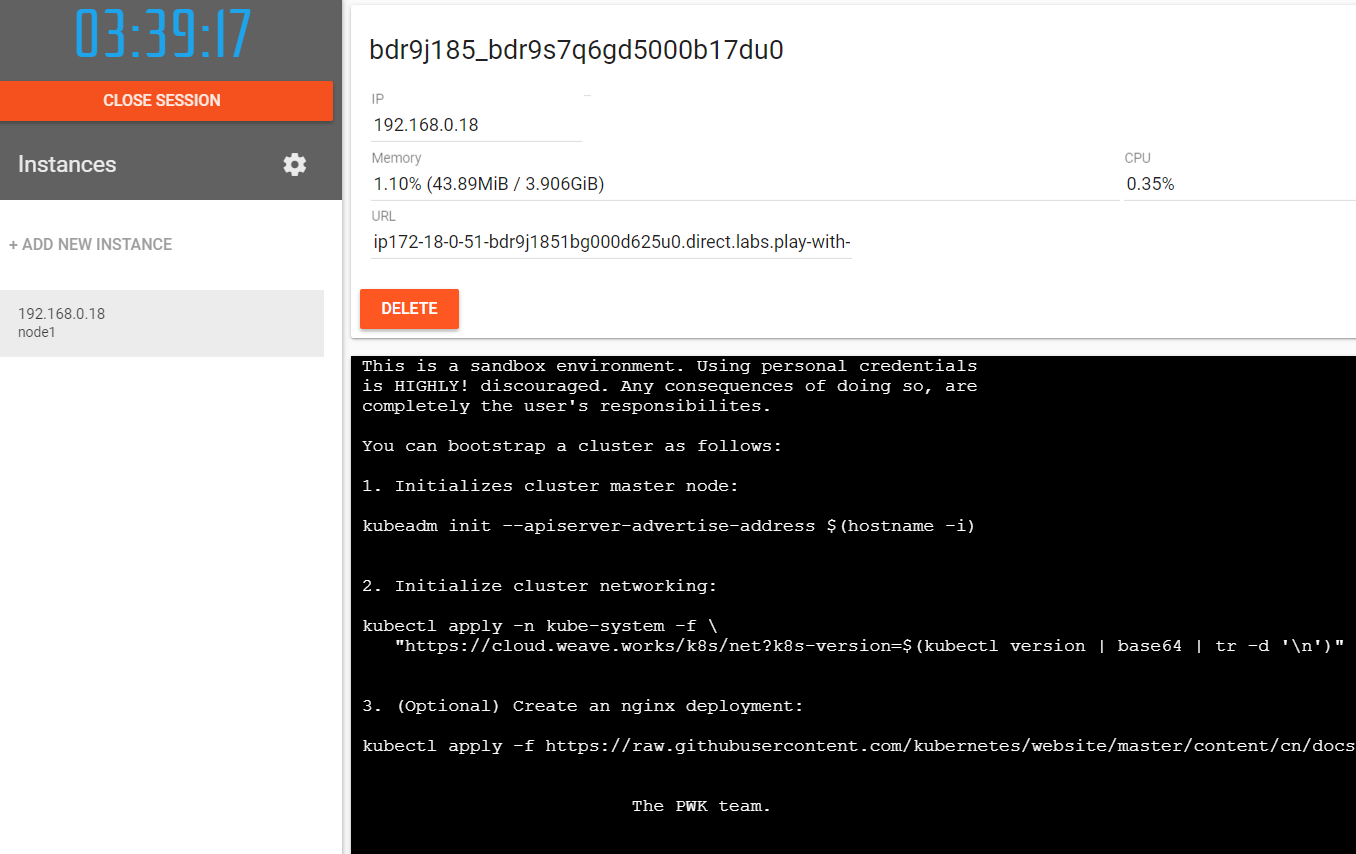
Click on “Add New Instance” on the left to build your first Kubernetes Cluster node. It automatically names it as “node1”. Each instance has Docker Community Edition (CE) and Kubeadm already pre-installed. This node will be treated as the master node for our cluster.

Bootstrapping the Master Node
You can bootstrap the Kubernetes cluster by initializing the master (node1) node with the below script. Copy this script content into bootstrap.sh file and make it executable using “chmod +x bootstrap.sh” command.
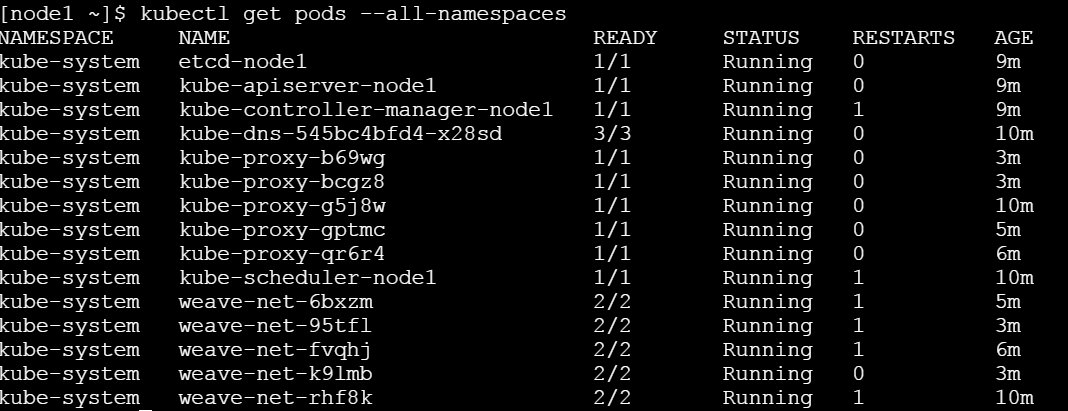
When you execute this script, as part of initialization, the kubeadm write several configuration files needed, setup RBAC and deployed Kubernetes control plane components (like kube-apiserver, kube-dns, kube-proxy, etcd, etc.). Control plane components are deployed as Docker containers.

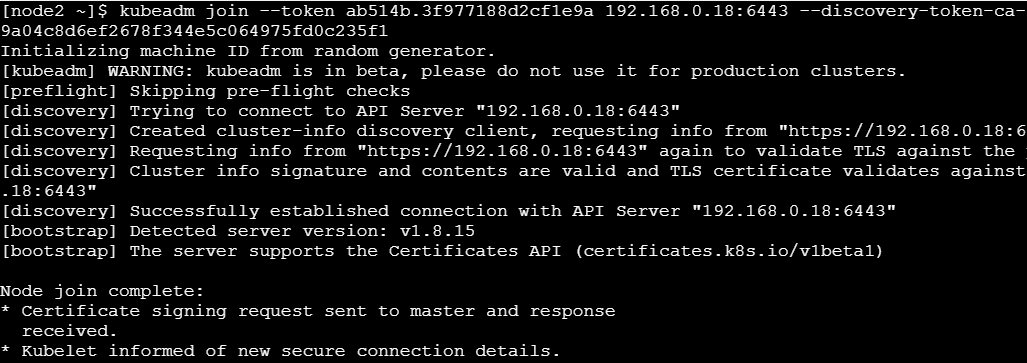
Copy the above kubeadm join token command and save it for the next step. This command will be used to join other nodes to your cluster.
Adding Worker Nodes
Click on “Add New Node” to add a new worker node.

Checking the Cluster Status
[node1 ~]$ kubectl get nodes
NAME      STATUS     ROLES     AGE       VERSION
node1     Ready      master    18m       v1.11.3
node2     Ready      <none>    4m        v1.11.3
node3     Ready      <none>    39s       v1.11.3
node4     NotReady   <none>    22s       v1.11.3
node5     NotReady   <none>    4s        v1.11.3
[node1 ~]$
[node1 ]$ kubectl get po
No resources found.
[node1 ]$ kubectl get svc
NAME         TYPE        CLUSTER-IP   EXTERNAL-IP   PORT(S)   AGE
kubernetes   ClusterIP   10.96.0.1    <none>        443/TCP   1h
[node1]$
Verifying the running Pods

[node1 ~]$ kubectl get nodes -o json |
>       jq ".items[] | {name:.metadata.name} + .status.capacity"
{
  "name": "node1",
  "cpu": "8",
  "ephemeral-storage": "10Gi",
  "hugepages-1Gi": "0",
  "hugepages-2Mi": "0",
  "memory": "32929612Ki",
  "pods": "110"
}
{
  "name": "node2",
  "cpu": "8",
  "ephemeral-storage": "10Gi",
  "hugepages-1Gi": "0",
  "hugepages-2Mi": "0",
  "memory": "32929612Ki",
  "pods": "110"
}
{
  "name": "node3",
  "cpu": "8",
  "ephemeral-storage": "10Gi",
  "hugepages-1Gi": "0",
  "hugepages-2Mi": "0",
  "memory": "32929612Ki",
  "pods": "110"
}
{
  "name": "node4",
  "cpu": "8",
  "ephemeral-storage": "10Gi",
  "hugepages-1Gi": "0",
  "hugepages-2Mi": "0",
  "memory": "32929612Ki",
  "pods": "110"
}
{
  "name": "node5",
  "cpu": "8",
  "ephemeral-storage": "10Gi",
  "hugepages-1Gi": "0",
  "hugepages-2Mi": "0",
  "memory": "32929612Ki",
  "pods": "110"
}
Installing OpenSSL
[node1 ~]$ yum install -y openssl
Installing Helm
$ curl https://raw.githubusercontent.com/helm/helm/master/scripts/get > get_helm.sh
$ chmod 700 get_helm.sh
$ ./get_helm.sh
[node1 ~]$ sh get_helm.sh
Downloading https://kubernetes-helm.storage.googleapis.com/helm-v2.11.0-linux-amd64.tar.gz
Preparing to install helm and tiller into /usr/local/bin
helm installed into /usr/local/bin/helm
tiller installed into /usr/local/bin/tiller
get_helm.sh: line 177: which: command not found
Run 'helm init' to configure helm.
[node1 ~]$ helm init
Creating /root/.helm
Creating /root/.helm/repository
Creating /root/.helm/repository/cache
Creating /root/.helm/repository/local
Creating /root/.helm/plugins
Creating /root/.helm/starters
Creating /root/.helm/cache/archive
Creating /root/.helm/repository/repositories.yaml
Adding stable repo with URL: https://kubernetes-charts.storage.googleapis.com
Adding local repo with URL: http://127.0.0.1:8879/charts
$HELM_HOME has been configured at /root/.helm.

Tiller (the Helm server-side component) has been installed into your Kubernetes Cluster.

Please note: by default, Tiller is deployed with an insecure 'allow unauthenticated users' policy.
To prevent this, run `helm init` with the --tiller-tls-verify flag.
For more information on securing your installation see: https://docs.helm.sh/using_helm/#securing-your-helm-installation
Happy Helming
Installing Prometheus
Let us try to install Prometheus Stack on top of 5-Node K8s cluster using Helm.
First one can search for application stack using helm search <packagename> option.
[node1 ~]$ helm search prometheus
NAME                                    CHART VERSION   APP VERSION     DESCRIPTION
stable/prometheus                       7.3.4           2.4.3           Prometheus is a monitoring system and time series database.
stable/prometheus-adapter               v0.2.0          v0.2.1          A Helm chart for k8s prometheus adapter
stable/prometheus-blackbox-exporter     0.1.3           0.12.0          Prometheus Blackbox Exporter
stable/prometheus-cloudwatch-exporter   0.2.1           0.5.0           A Helm chart for prometheus cloudwatch-exporter
stable/prometheus-couchdb-exporter      0.1.0           1.0             A Helm chart to export the metrics from couchdb in Promet...
stable/prometheus-mysql-exporter        0.2.1           v0.11.0         A Helm chart for prometheus mysql exporter with cloudsqlp...
stable/prometheus-node-exporter         0.5.0           0.16.0          A Helm chart for prometheus node-exporter
stable/prometheus-operator              0.1.7           0.24.0          Provides easy monitoring definitions for Kubernetes servi...
stable/prometheus-postgres-exporter     0.5.0           0.4.6           A Helm chart for prometheus postgres-exporter
stable/prometheus-pushgateway           0.1.3           0.6.0           A Helm chart for prometheus pushgateway
stable/prometheus-rabbitmq-exporter     0.1.4           v0.28.0         Rabbitmq metrics exporter for prometheus
stable/prometheus-redis-exporter        0.3.2           0.21.1          Prometheus exporter for Redis metrics
stable/prometheus-to-sd                 0.1.1           0.2.2           Scrape metrics stored in prometheus format and push them ...
stable/elasticsearch-exporter           0.4.0           1.0.2           Elasticsearch stats exporter for Prometheus
stable/karma                            1.1.2           v0.14           A Helm chart for Karma - an UI for Prometheus Alertmanager
stable/stackdriver-exporter             0.0.4           0.5.1           Stackdriver exporter for Prometheus
stable/weave-cloud                      0.3.0           1.1.0           Weave Cloud is a add-on to Kubernetes which provides Cont...
stable/kube-state-metrics               0.9.0           1.4.0           Install kube-state-metrics to generate and expose cluster...
stable/mariadb                          5.2.2           10.1.36         Fast, reliable, scalable, and easy to use open-source rel...
[node1 ~]$
Update the Repo
[node1 ~]$ helm repo update
Hang tight while we grab the latest from your chart repositories...
...Skip local chart repository
...Successfully got an update from the "stable" chart repository
Update Complete. ⎈ Happy Helming!⎈
Installing Prometheus
$helm install stable/prometheus
Error: namespaces “default” is forbidden: User “system:serviceaccount:kube-system:default” cannot get namespaces in the namespace “default”
How to fix?
To fix this issue, you need to follow below steps:
kubectl --namespace kube-system create serviceaccount tiller
kubectl create clusterrolebinding tiller --clusterrole cluster-admin --serviceaccount=kube-system:tiller
helm init --service-account tiller --upgrade
Listing Helm
[node1 ~]$ helm list
NAME            REVISION        UPDATED                         STATUS          CHART                   APP VERSION     NAMESPACE
excited-elk     1               Sun Oct 28 10:00:02 2018        DEPLOYED        prometheus-7.3.4        2.4.3           default
[node1 ~]$ helm repo update
Hang tight while we grab the latest from your chart repositories...
...Skip local chart repository
...Successfully got an update from the "stable" chart repository
Update Complete. ⎈ Happy Helming!⎈
[node1 ~]$ helm install stable/prometheus
NAME:   excited-elk
LAST DEPLOYED: Sun Oct 28 10:00:02 2018
NAMESPACE: default
STATUS: DEPLOYED

RESOURCES:
==> v1beta1/DaemonSet
NAME                                  AGE
excited-elk-prometheus-node-exporter  1s

==> v1/Pod(related)

NAME                                                        READY  STATUS             RESTARTS  AGE
excited-elk-prometheus-node-exporter-7bjqc                  0/1    ContainerCreating  0         1s
excited-elk-prometheus-node-exporter-gbcd7                  0/1    ContainerCreating  0         1s
excited-elk-prometheus-node-exporter-tk56q                  0/1    ContainerCreating  0         1s
excited-elk-prometheus-node-exporter-tkk9b                  0/1    ContainerCreating  0         1s
excited-elk-prometheus-alertmanager-68f4f57c97-wrfjz        0/2    Pending            0         1s
excited-elk-prometheus-kube-state-metrics-858d44dfdc-vt4wj  0/1    ContainerCreating  0         1s
excited-elk-prometheus-pushgateway-58bfd54d6d-m4n69         0/1    ContainerCreating  0         1s
excited-elk-prometheus-server-5958586794-b97xn              0/2    Pending            0         1s

==> v1/ConfigMap

NAME                                 AGE
excited-elk-prometheus-alertmanager  1s
excited-elk-prometheus-server        1s

==> v1/ServiceAccount
excited-elk-prometheus-alertmanager        1s
excited-elk-prometheus-kube-state-metrics  1s
excited-elk-prometheus-node-exporter       1s
excited-elk-prometheus-pushgateway         1s
excited-elk-prometheus-server              1s

==> v1beta1/ClusterRole
excited-elk-prometheus-kube-state-metrics  1s
excited-elk-prometheus-server              1s

==> v1beta1/Deployment
excited-elk-prometheus-alertmanager        1s
excited-elk-prometheus-kube-state-metrics  1s
excited-elk-prometheus-pushgateway         1s
excited-elk-prometheus-server              1s

==> v1/PersistentVolumeClaim
excited-elk-prometheus-alertmanager  1s
excited-elk-prometheus-server        1s

==> v1beta1/ClusterRoleBinding
excited-elk-prometheus-kube-state-metrics  1s
excited-elk-prometheus-server              1s

==> v1/Service
excited-elk-prometheus-alertmanager        1s
excited-elk-prometheus-kube-state-metrics  1s
excited-elk-prometheus-node-exporter       1s
excited-elk-prometheus-pushgateway         1s
excited-elk-prometheus-server              1s


NOTES:
The Prometheus server can be accessed via port 80 on the following DNS name from within your cluster:
excited-elk-prometheus-server.default.svc.cluster.local


Get the Prometheus server URL by running these commands in the same shell:
  export POD_NAME=$(kubectl get pods --namespace default -l "app=prometheus,component=server" -o jsonpath="{.items[0].metadata.name}")
  kubectl --namespace default port-forward $POD_NAME 9090


The Prometheus alertmanager can be accessed via port 80 on the following DNS name from within your cluster:
excited-elk-prometheus-alertmanager.default.svc.cluster.local


Get the Alertmanager URL by running these commands in the same shell:
  export POD_NAME=$(kubectl get pods --namespace default -l "app=prometheus,component=alertmanager" -o jsonpath="{.items[0].metadata.name}")
  kubectl --namespace default port-forward $POD_NAME 9093


The Prometheus PushGateway can be accessed via port 9091 on the following DNS name from within your cluster:
excited-elk-prometheus-pushgateway.default.svc.cluster.local


Get the PushGateway URL by running these commands in the same shell:
  export POD_NAME=$(kubectl get pods --namespace default -l "app=prometheus,component=pushgateway" -o jsonpath="{.items[0].metadata.name}")
  kubectl --namespace default port-forward $POD_NAME 9091

For more information on running Prometheus, visit:
https://prometheus.io/
[node1 ~]$ kubectl get all
NAME                                                             READY     STATUS    RESTARTS   AGE
pod/excited-elk-prometheus-alertmanager-68f4f57c97-wrfjz         0/2       Pending   0          3m
pod/excited-elk-prometheus-kube-state-metrics-858d44dfdc-vt4wj   1/1       Running   0          3m
pod/excited-elk-prometheus-node-exporter-7bjqc                   1/1       Running   0          3m
pod/excited-elk-prometheus-node-exporter-gbcd7                   1/1       Running   0          3m
pod/excited-elk-prometheus-node-exporter-tk56q                   1/1       Running   0          3m
pod/excited-elk-prometheus-node-exporter-tkk9b                   1/1       Running   0          3m
pod/excited-elk-prometheus-pushgateway-58bfd54d6d-m4n69          1/1       Running   0          3m
pod/excited-elk-prometheus-server-5958586794-b97xn               0/2       Pending   0          3m

NAME                                                TYPE        CLUSTER-IP      EXTERNAL-IP   PORT(S)    AGE
service/excited-elk-prometheus-alertmanager         ClusterIP   10.106.159.46   <none>        80/TCP     3m
service/excited-elk-prometheus-kube-state-metrics   ClusterIP   None            <none>        80/TCP     3m
service/excited-elk-prometheus-node-exporter        ClusterIP   None            <none>        9100/TCP   3m
service/excited-elk-prometheus-pushgateway          ClusterIP   10.106.88.15    <none>        9091/TCP   3m
service/excited-elk-prometheus-server               ClusterIP   10.107.15.64    <none>        80/TCP     3m
service/kubernetes                                  ClusterIP   10.96.0.1       <none>        443/TCP    37m

NAME                                                  DESIRED   CURRENT   READY     UP-TO-DATE   AVAILABLE   NODE SELECTOR   AGE
daemonset.apps/excited-elk-prometheus-node-exporter   4         4         4         4            4           <none>          3m

NAME                                                        DESIRED   CURRENT   UP-TO-DATE   AVAILABLE   AGE
deployment.apps/excited-elk-prometheus-alertmanager         1         1         1            0           3m
deployment.apps/excited-elk-prometheus-kube-state-metrics   1         1         1            1           3m
deployment.apps/excited-elk-prometheus-pushgateway          1         1         1            1           3m
deployment.apps/excited-elk-prometheus-server               1         1         1            0           3m

NAME                                                                   DESIRED   CURRENT   READY     AGE
replicaset.apps/excited-elk-prometheus-alertmanager-68f4f57c97         1         1         0         3m
replicaset.apps/excited-elk-prometheus-kube-state-metrics-858d44dfdc   1         1         1         3m
replicaset.apps/excited-elk-prometheus-pushgateway-58bfd54d6d          1         1         1         3m
replicaset.apps/excited-elk-prometheus-server-5958586794               1         1         0         3m
[node1 ~]$
Wait for few minutes while you can access Prometheus UI using https://<external-ip>:9090 In the upcoming blog series, I will bring more interesting stuffs around Helm on PWD Playground.
Kubernetes Hands-on Lab #3 – Deploy Istio Mesh on K8s Cluster

